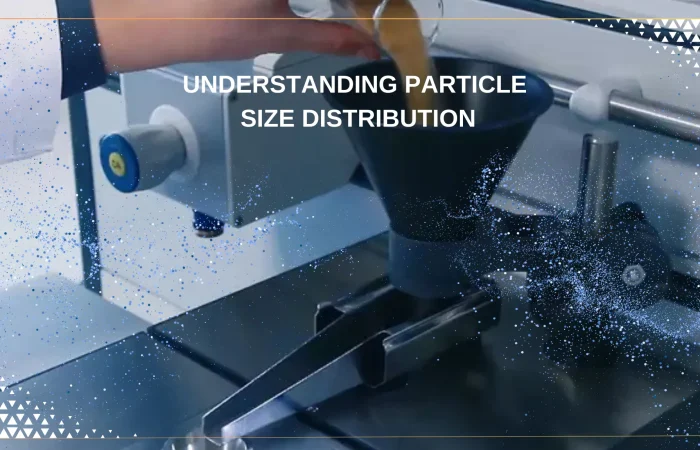
Understanding Particle Size Distribution: Methods, Applications, and Microtrac Solutions
9.
Understanding Particle Size Distribution: Methods, Applications, and Microtrac Solutions
-
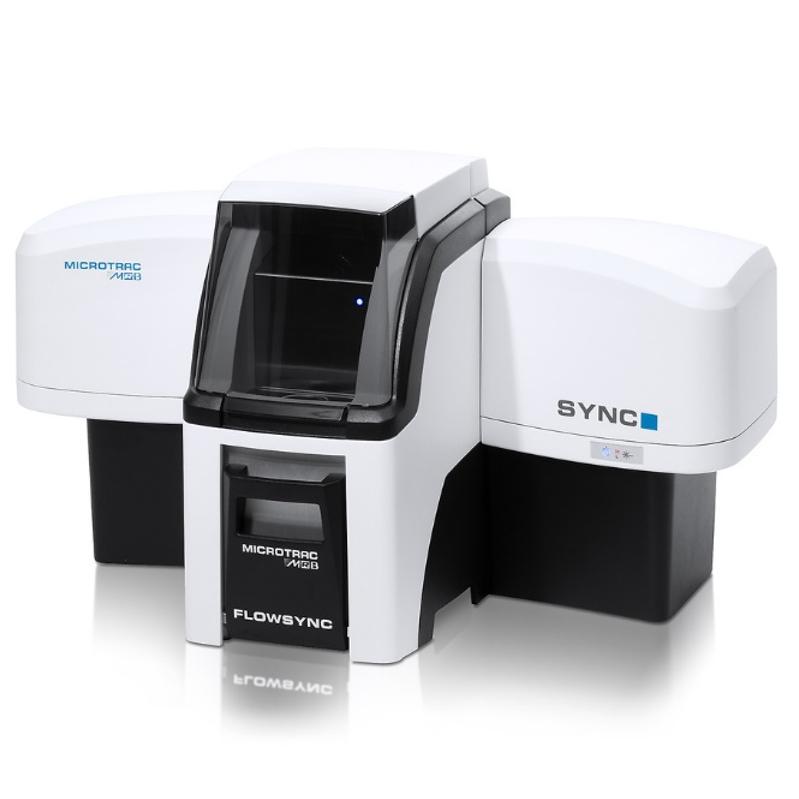
Microtrac SYNC Particle Size and Shape Analyzer
Microtrac SYNC is a particle size and shape analyzer integrating highly accurate tri-laser diffraction analyzer technology with versatile dynamic image...
-
Brand:
Microtrac
-
Brand:
-
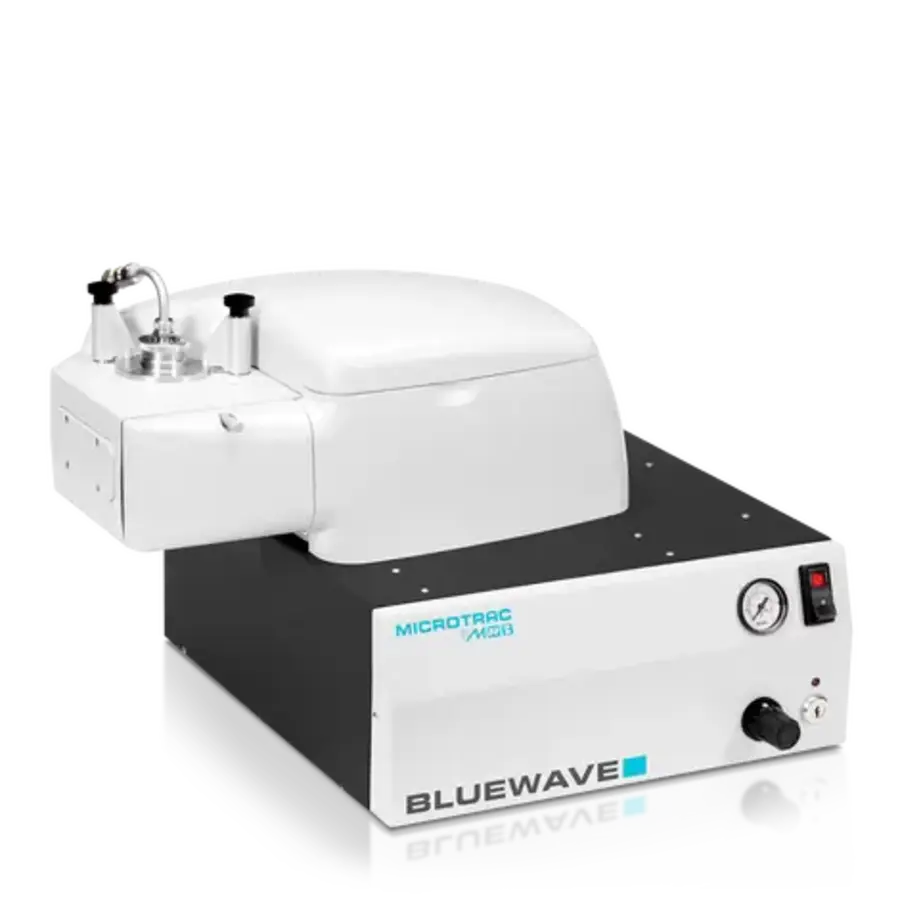
Microtrac BLUEWAVE Particle Size Analyzer
The Microtrac BLUEWAVE is a Laser Diffraction analyzer optimized for materials below 1 micron delivering unsurpassed resolution.
-
Brand:
Microtrac
-
Brand:
-
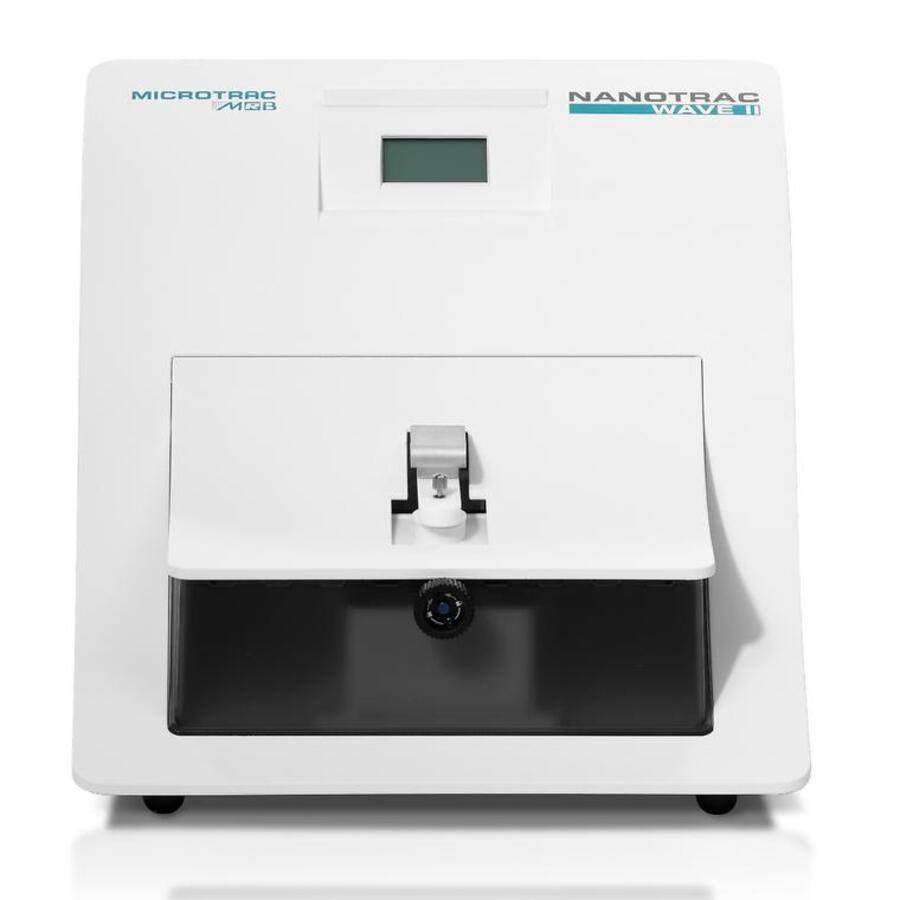
Microtrac NANOTRAC WAVE II Nanoparticle Size Analyzer
Microtrac’s NANOTRAC WAVE II is a highly flexible Dynamic Light Scattering (DLS) analyzer providing information on particle size, zeta potential,...
-
Brand:
Microtrac
-
Brand:
Related Posts